Passing --stats to Crystal when building or running any source code gives you a list of compilation stages and their times elapsed, the first stage being Parse. Most of the time, this stage takes less than 1 millisecond, even when rebuilding a large codebase like the compiler itself. This is naturally impossible, no matter how fast your computer runs.
The reason here is that the scope of the stage is very small. It measures only the time taken to parse the entry points given on the command line, not the time taken for required files; they are parsed as Require nodes are visited by the top-level visitor, meaning all that elapsed time counts towards the Semantic (top level) stage instead. Knowing that all the parsing goes through Crystal::Parser#parse, here is a rudimentary patch that prints the total time taken for all invocations of that method:
module Crystal
  class Parser
    class_property elapsed = Time::Span.zero

    def parse
      t0 = Time.monotonic
      begin
        previous_def
      ensure
        t1 = Time.monotonic
        Parser.elapsed += t1 - t0
      end
    end
  end

  class Compiler
    private def print_codegen_stats(units)
      return unless @progress_tracker.stats?
      puts "Parse total: #{Parser.elapsed}"
      previous_def
    end
  end
end
We then build an empty file with --stats, meaning the prelude is solely responsible for all the parsing. On Windows, a typical run looks like this:
Parse:                             00:00:00.000625400 (   1.16MB)
Semantic (top level):              00:00:00.371690400 ( 129.64MB)
Semantic (new):                    00:00:00.001411500 ( 129.64MB)
Semantic (type declarations):      00:00:00.022352500 ( 129.64MB)
Semantic (abstract def check):     00:00:00.008010900 ( 145.64MB)
Semantic (restrictions augmenter): 00:00:00.006648800 ( 145.64MB)
Semantic (ivars initializers):     00:00:00.095378200 ( 145.70MB)
Semantic (cvars initializers):     00:00:00.003065200 ( 145.70MB)
Semantic (main):                   00:00:00.212487200 ( 193.82MB)
Semantic (cleanup):                00:00:00.000268600 ( 193.82MB)
Semantic (recursive struct check): 00:00:00.000578700 ( 193.82MB)
Codegen (crystal):                 00:00:00.199303900 ( 193.82MB)
Codegen (bc+obj):                  00:00:00.182948200 ( 209.82MB)
Codegen (linking):                 00:00:00.714077300 ( 209.82MB)
Parse total: 00:00:00.268039300
0.27 second, or over 70% of the top-level phase, is spent on parsing source code. It may seem little compared to the main and codegen phases, but definitely contributes to the slowless perceived by some newcomers running their first Hello World program and other short scripts. It also dominates compiler components that only require the top-level semantic pass, like the docs generator and the hierarchy tool. Below is a flame graph showing the same symptom: (this is done on Debian WSL)
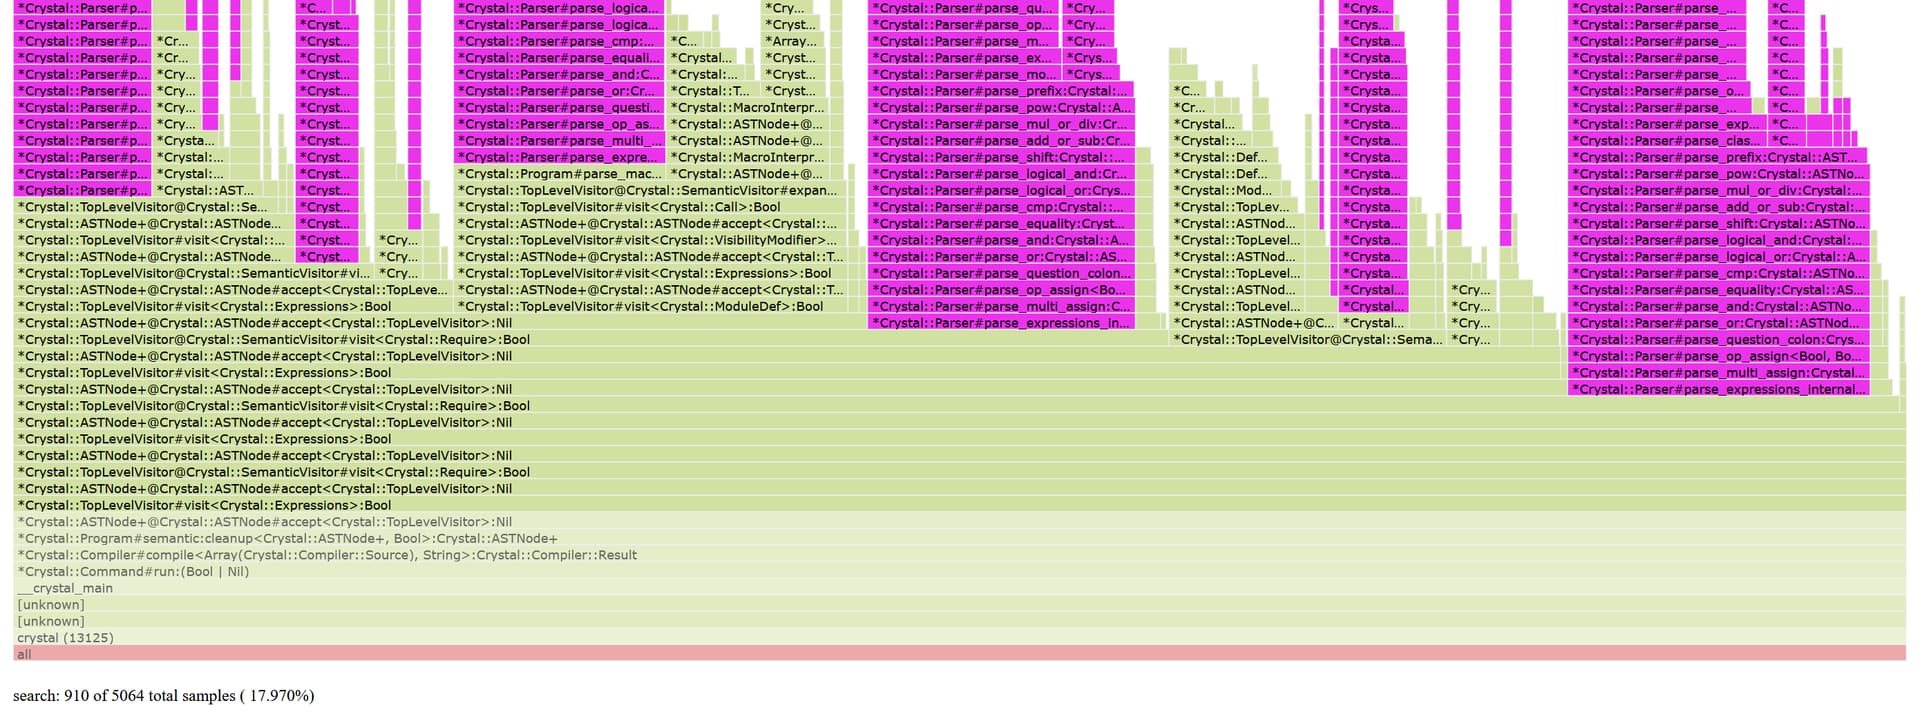
The graph is focused on the outermost stack frame involving the top-level visitor, and all the highlighted frames are instance methods of Crystal::Parser. They indeed occupy the majority of the top-level phase.
Traditionally, much of the work on improving compilation times has been directed at the codegen phases, and there was little attention to the parser. There are probably many missed optimization opportunities here, and we may want better reporting facilities for --stats too, not least because the stages of interest are not perfectly sequential, i.e. parsing could happen in the middle of the main phase too for macro methods referring to the @type macro variable.